KPI Summary
The KPI Summary shows a collection of results information that you want to be able to conveniently see together (perhaps at the end of each simulation run you perform).
Access this through the Results Manager button on the Home tab.
The information in the KPI summary window is updated at the end of each simulation run and also at the end of each simulation trial.
At the end of run you get a single number, either as an average, or as a limit value - for example when the result is something like a “maximum” size of a Queue. The result is the relevant value that was found over the length of the simulation run. For example, if the simulation runs for one week, and you look at a result like “average time in Queue” then the result figure is the average of all the individual times that Work Items spent in the Queue.
At the end of trial you get a confidence interval range with your result. A confidence interval tells you that your results on average will be X but if it's not X then Simul8 is 95% confident that the values will be between Z and Y. So the smaller the gap between Z and Y, the less variability there is in your results and the more confident you can be that the value you will see in the real world will be close to the average.
After running a trial, you will also be presented with a Risk column, which will generate a MORE Plot for each of your KPIs.
Data on the KPI Summary can be copied using the Copy button and pasted into a package such as Excel or a database. Also the Results Export function can export the data in the KPI Summary to a compatible package.
Results from previous runs and trials can be viewed together using the Compare button.
Before printing the preview function allows you to check that the KPI Summary will print in the manner you require.
Adding Results to the KPI Summary
Any property values of any Object can be added to the KPI Summary. They can be added in two ways:
Add Objects Results Using the Object Dialog
To add a Result value of an Object to the KPI Summary, go to the Object’s Results dialog that displays Simul8 Object Results, under the Properties tab, and right-click on the Result value you want to be displayed in the KPI Summary. This will be added to the KPI Summary immediately and the value on the KPI Summary will be automatically updated from the dialog box whenever a simulation run (or trial) ends. The mouse arrow contains a letter “R” when you hover over a Result value that can be added to the KPI Summary. The Result value will also become bold when it is added to the KPI Summary.

Add Objects Properties Using the Results Manager
You can also add Objects’ Properties, using the Results Manager. Go to the Results Manager and click on the KPIs tab. Add KPIs using the plus sign, shown below. Click on “Select Any Properties” and check all the Properties you want to add.
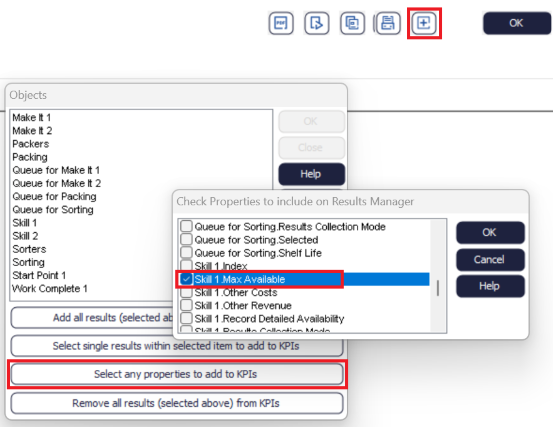
This method is really useful when you have results from multiple objects to add, as it allows you to bulk add many object results to the KPI summary at the same time.