KPI History
Simul8 collects the results of each run and stores it in the Comparison table. This is an automatic log of the results from each run.
Access this report from the Results Manager button on the Home tab.
The Compare table stores the data from the KPI Summary after each Run or Trial and will store over 200 runs worth of data.
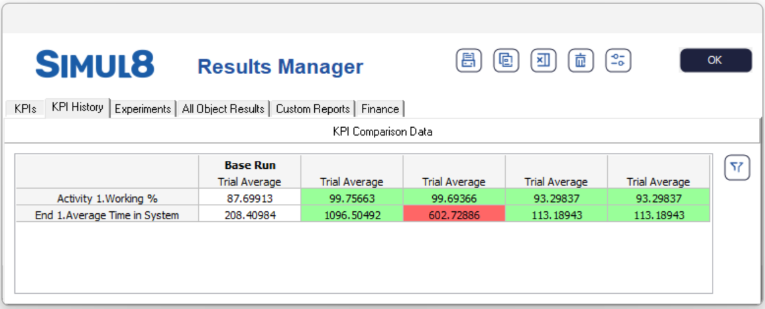
Now you can see the best performing scenario at a glance. The first column is the most recent run, and cells color changes to show improvements and deterioration in KPIs, i.e. if the result is better (or the same) than the base run (i.e. the most recent run), cells are colored green, and if it is worse than the base run cells are colored red. Improvement is defined as higher or lower values, depending on the result in question. For example, Revenue results are green if higher, and Carbon Emissions results are red if higher. Each Object has its own function to return if a higher result means a better outcome.
If a Trial is run then the Average value is stored in the Compare table. The results from each run of the Trial are stored, but are not entered in the Compare table. Use the Results Copy button to copy the Results of the Trial and then Paste them to another application.
See the Results tab in preferences to specify whether Simul8 should:
- Store run results
- Store trial results
- Store all results for every run in a trial
- Store the trial average
- Store the trial ranges