Queue Visualization
Simul8 2014 introduces a new ways to look at your queues; by displaying each work item’s specified label value at a glance.
In the Label Block options, you must choose a label for which you want to see. Enter the high and low values, and choose colors to represent these values. Any values in between will represent a gradient.
You also have control over the size of queue’s appearance, as well as the style.
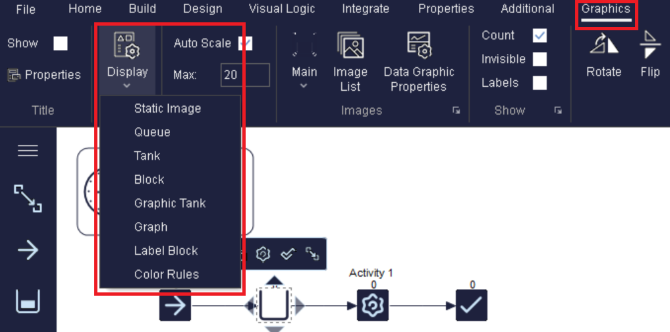
To access this option, select a queue on screen, navigate to the Graphics Tab, and choose “Label Block” from the Display dropdown.
The Interface
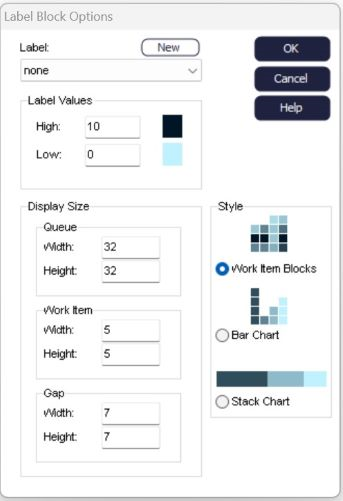
The above dialog will allow you to control the appearance of the work items within the queue.
Label: Choose the label for which you want to use for your queue.
Label Values: Choose the high and low values which you want to represent for the label value chosen. Any colors in between these values will appear as a gradient between the high and low value's color.
Display Size: Choose the width and height of the queue on the simulation window.
Work Item: Choose the width and height of each individual work item displayed in the queue.
Gap: Choose the width and height of the gap between the work items in the queue.
Style: This allows you to choose how to represent your work items.
- Work Item Blocks: Displays work items as they arrive into the queue. There is no organization of work items using this style.
- Bar Chart: Displays the work items as a bar chart. This will segregate the work items by color (value) and display the amount of each value.
- Stack Chart: Displays a horizontal chart to gauge the percentage of each value in the queue.