Stat::Fit Example Tutorial
Stat::Fit is a plug-in for Simul8 desktop only. It is a simple way of knowing which distributions will work best throughout your simulation. This is done by copying raw data into the software then simply auto fitting it to appropriate distributions. Once you have this information you can input it into Simul8 and fill in the parameters with the recommended values.
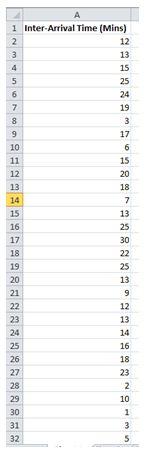
In this example we'll take some example raw data for Inter-arrival times and input this into Stat::Fit to find out the correct distribution to use on the Start Point.

Here this example data is in a Microsoft Excel format but other applications such as Notepad or other spreadsheet tools could also be used.
- Select all numerical values for the data you are using and copy these
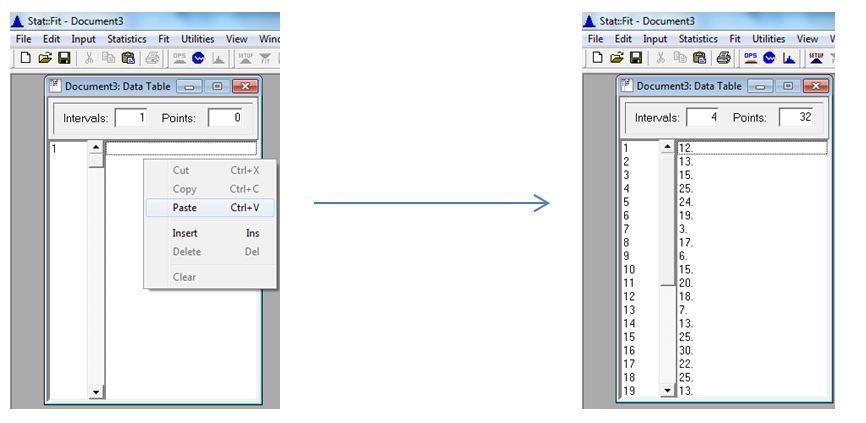
- Open Stat::Fit from within Simul8 under the advanced tab
- Right-click on the data table and select paste

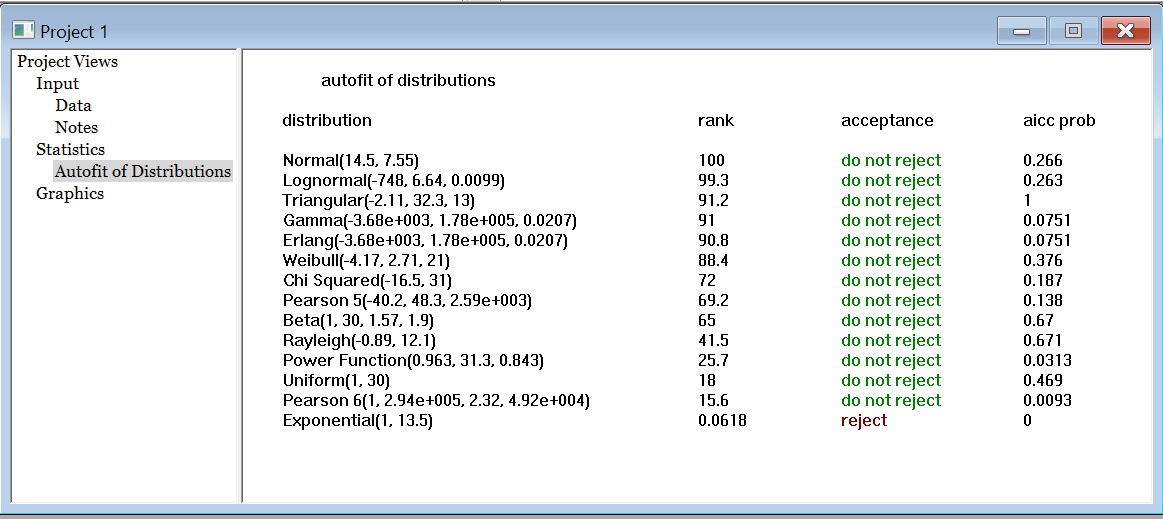
- Click AUTOFIT on the toolbar and select UNBOUNDED in the second box then click OK
- You should now see acceptable distributions

- In this case let's choose a Normal Distribution because it has been ranked the highest but if something like a Lognormal distribution was more appropriate, there is not enough evidence from this small dataset to suggest this is wrong, so we could equally choose this
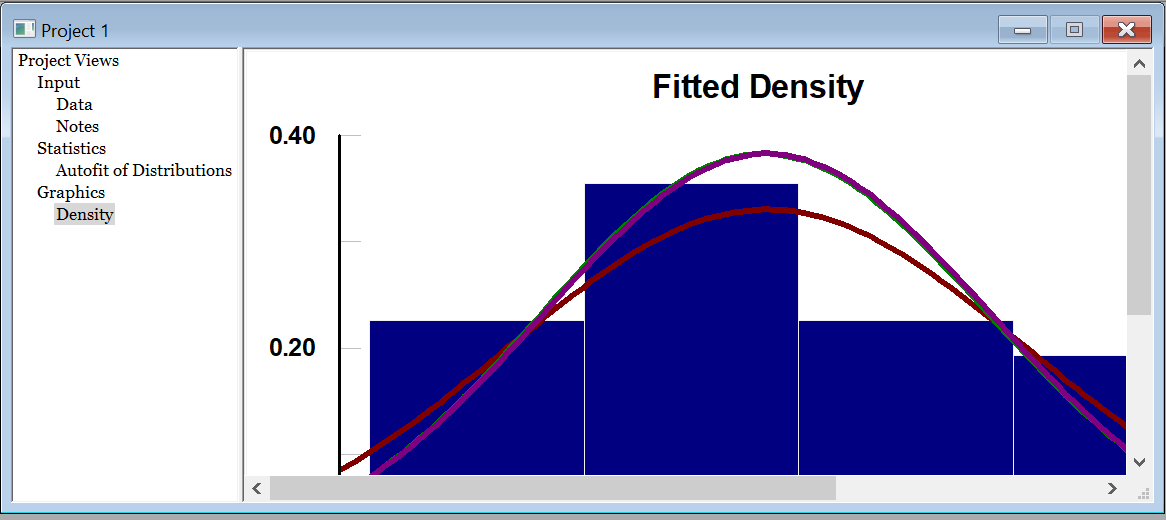
- By clicking the Graph Fit button we can also see what any of my possible distributions look like compared to the data

Since we have chosen a normal distribution we just enter this into the Start Point in Simul8 with the parameters shown of Average 14.7 and standard deviation of 7.55.
If you'd like to know more about Stat::Fit with Simul8 or if you have any questions about this tutorial feel free to get in touch - we're always happy to help!