Set Prob-Profile Distrib Column
Sets the sample value and percentage values for a single column (cell) in a probability profile distribution. Percentage chance values for columns to the right of the “Column Number” column are adjusted so that the total percentage = 100.
Parameters
- Distribution Name - Probability Profile Distribution
- Column Number - Column you wish to set (1= left most column in dialog)
- Sample Value - The value sampled from the distribution.
- Percentage Chance - The chance (0-100) of this column being sampled.
Comments
As columns to the right are adjusted to ensure total percentage = 100 you are recommended to only set columns in numerical (left to right) sequence.
Example
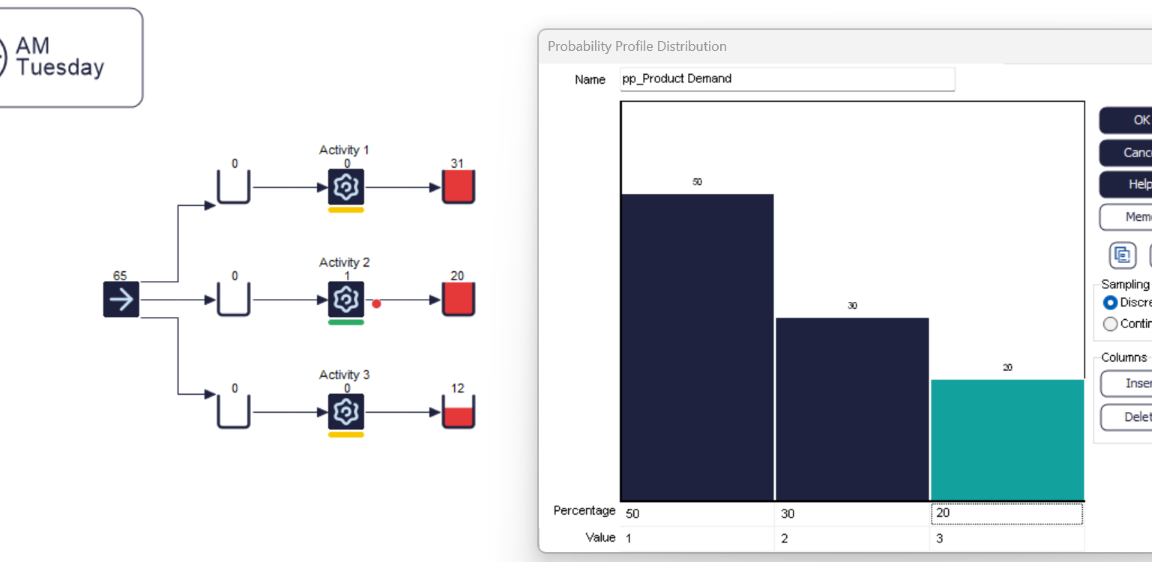
Often, the above command is called at specific times during a simulation. For instance, like in this example, we can use it to change a schedule of different product types which are fed into the simulation for each day. In order to do that, we first create the Probability Profile and give it a name. The values are not important at this stage as we will dynamically change them via Visual Logic during the simulation run.
Next, we create an internal spreadsheet in which we specify three product types and their daily proportions that come into the simulation.
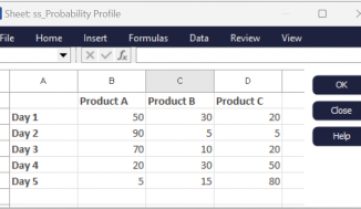
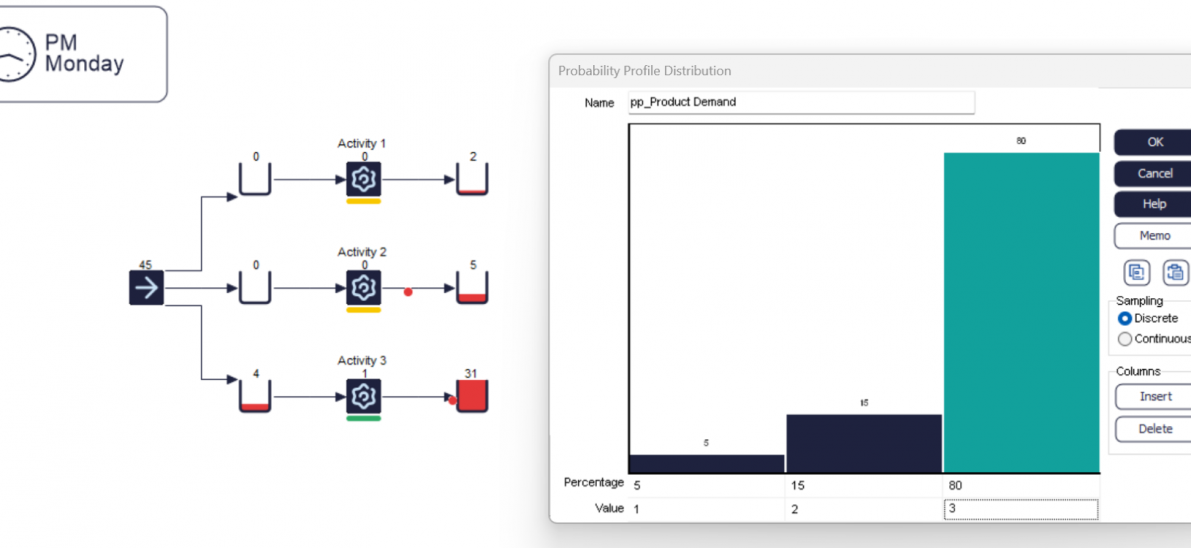
The internal spreadsheet will set the percentage column of the Probability Profile for Product A, B and C which are represented by the sample values of 1, 2 and 3. The sample values are used to set a Label “lbl_ProductType” at the Start Point which in turn determines in which production line a Work Item is routed out to.
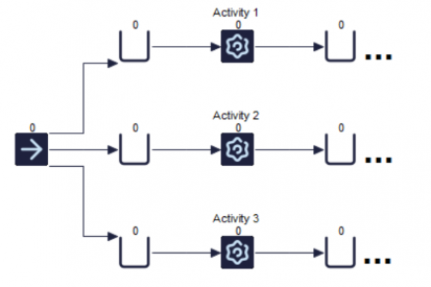
Work items with “lbl_ProductType” = 1 go in the upper/first line, Work Items with a Label value of 2 in the second and with a Label of 3, a Work Item gets routed to the third line.
The proportions of product types are changed daily by calling Simul8's Time Check Visual Logic at the end of each day (every 480 minutes, i.e. 8 hours times 60 minutes) in addition to the first minute of the simulation and update the Probability Profile columns according the the internal spreadsheet.
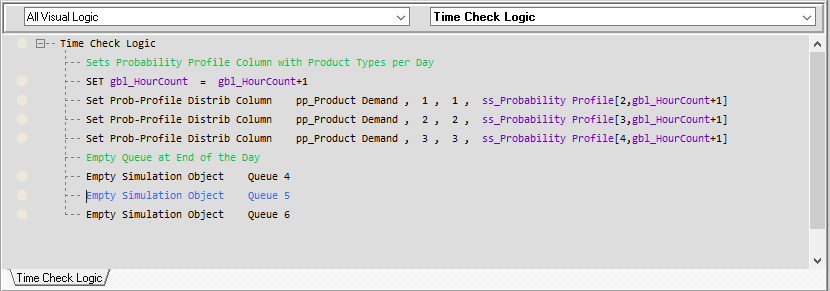
The upper part of the code updates the Probability Profile columns whereas the last three lines are only used to empty the final Queues to show the following results better. As we can see exemplary for the end of the first day (Monday), the percentages of the Probability Profile have been set and used accordingly. Similarly, at the end of Friday we can see that the Probability Profile has been automatically updated.
You can find a simulation example on the use of this command here: set_prob_profile_distrib_column.s8