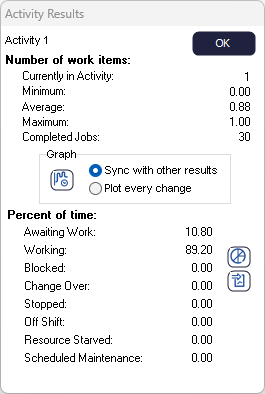
Activity Results
 Double click on any Activity onscreen and click the results button to access it's results.

 Click the Pie Chart button to see a Pie Chart of the percentage of time the Activity has spent in each state.
 Click the Time Graph button to see the number of items in the Activity over time.
State Definitions
Note this additional state results are not available if you are using Replicate in your Activity.
Awaiting Work
The Activity is ready to process work, but there are no Work Items in any objects that feed it waiting to be processed.
Working
The Activity is processing Work Items.
Blocked
The Activity has completed processing the Work Item but the objects it routes out to don't have any capacity to accept the completed Work Item. Therefore, the Work Item must stay in this Activity and the Activity is blocked from accepting any new work.
Stopped
The Activity has efficiency settings that mean the Activity is broken down and no work can be processed until it is repaired.
Change Over
When a Activity starts processing a different type of work, it can be set up to do a change over. This is extra time the Activity must spend setting up to be able to process the work. Change over records the amount of time the Activity has spent setting up.
Off Shift
Activities can have their availability constrained to certain times of the day using shifts. This records the amount of time the Activity has been unavailable to process work because it has not been available due to a shift constraint.
Resource Starved
The Activity is available to process work, there is work waiting in a feeding object for it to process, but there are no Resources available for it to use.
Overtime Results
If you have run the simulation with Overtime enabled you will have additional overtime results available.