Custom Reports
Custom Reports let you create your own tailored reports, showing the exact information you want, formatted how you like. Custom Reports are useful when presenting data and results to different stakeholders within the project. No coding experience is required for building a Custom Report, and it can be exported to a pdf format.
How to create and use Custom Reports
You can access and create a Custom Report by clicking on Custom Reports under the Home Tab. Alternatively, you can access Custom Reports by clicking on the Results Manager, and then on Custom Reports. The Custom Report operates in 2 modes: edit and non-edit mode. The mode is specified via the Design view checkbox.
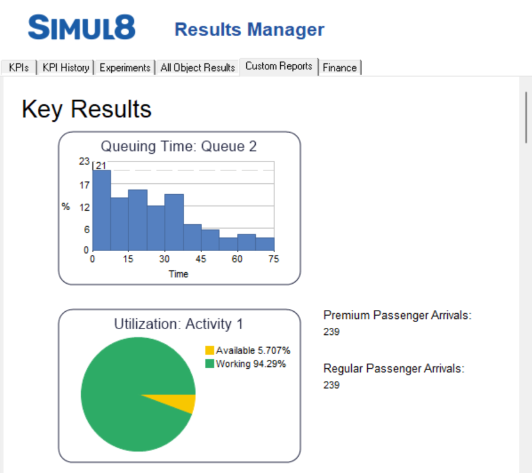
Clicking Add creates a new custom report that can be re-named. When in non-edit mode the report is not editable. The report displays the values of results, and it appears as it will be, when finalised and exported.
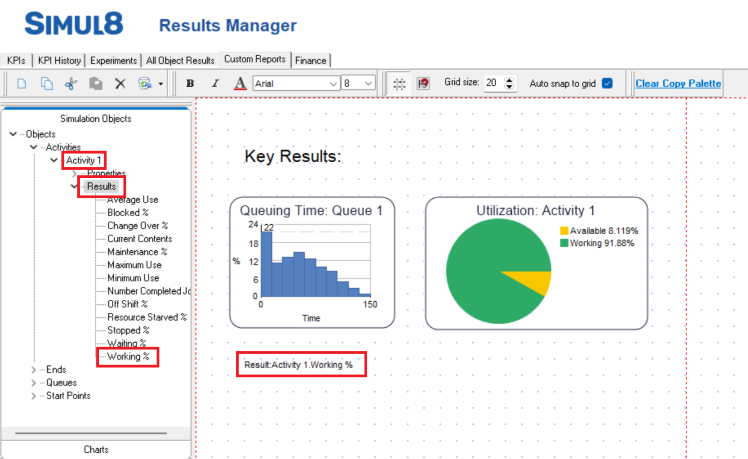
When in edit mode, with a custom report selected, Results and Information can be dragged from the left-hand window and positioned onto the main window.
The information that can be added to your Custom Report include:
- Simulation Object Results and Properties
- Custom Charts
- Variables from the Information Store
- KPIs (including Trial results)
- Display graphics including text, shapes and images. You can access these if you select Additional.
These are available to the left-hand side of the Custom Reports window.


