Optimize performance,
meet future targets
Simul8 simulation software is utilized to optimize key performance metrics including Jobs Per Hour, Overall Equipment Effectiveness and return on investment.
Why use simulation for optimizing manufacturing performance metrics?
Identify bottlenecks, support continuous improvement and maintain production targets.
With advancements in connected machinery and the rise of big data, most plants will be collecting real-time shop floor metrics including OEE, Working, Blocked, Waiting and Downtime. But how can manufacturers utilize big data?
Using Simul8, this data can drive further 'what-if' simulation analysis, aid continuous improvement programs and ensure a production facility continues to meet future performance targets.
How can simulation optimize key performance objectives?

Improving Jobs Per Hour (JPH)
The overall throughput of a bodyshop is usually measured by the average vehicles produces per hour; often referred to as “Net Jobs per Hour” (Net JPH).
Achieving optimum throughput is essential for manufacturers as overproduction wastes resources and jeopardizes budgets, while not meeting with customer demand impacts on earnings and market share.
Simul8's simulation software is an essential tool for testing and proving manufacturing line output to meet projected production targets within budget and achieve target revenue.

Assessing financial costs
With a key objective of maximizing production efficiency at the lowest cost, it is important to monitor the financial costs and return on investment of production lines.
With simulation, financial cost metrics including capital costs and respective usage costs per station including labor can be tracked and affordability assessed.
This is useful when building project buy-in as cost implications can be easily communicated across different scenarios. For example, when assessing if high cost technology stations are worth the return on investment.

First Pass Yield (FPY)
Quality is always a priority for manufacturers when it comes to performance metrics. Reducing rework items and scrap not only improves throughput, but it reduces waste and costs. Many manufacturers measure quality by First Pass Yield.
How is First Pass Yield calculated?
FPY = (Good Parts-Scrap-Rework)/Total Parts
First Pass Yield is defined as dividing the number of good units with no rework or scrap by the total number of units that were released over a discrete time interval.
Simulation can aid reducing rework by improving processes throughout the production line and determining the best locations for elements including rework inspection and scrap stations.
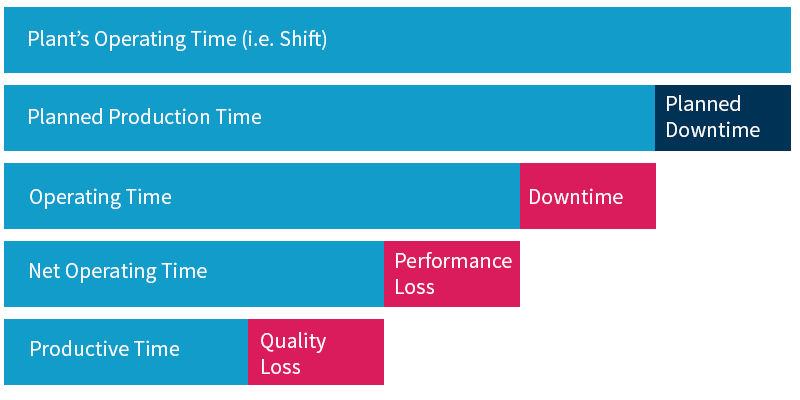
There are various time segments that make up a plant’s production time
Overall Equipment Effectiveness (OEE)
OEE is a multidimensional metric that strives to get the most out of a plants’ planned production time by focusing on three key factors: availability, performance, and quality.
Most that large organizations review OEE on a weekly basis and manufacturing engineers usually have to present ideas and concepts that will improve efficiency.
How is OEE calculated?
Availability = Operating Time / Planned Production Time
Performance = [Total Jobs/Operating Time] / Design Rate
Quality = Good Jobs / Total Jobs
OEE = Availability * Performance * Quality
After factoring out planned and unplanned downtime factors, a typical working shift can dwindle-down to a relatively small fraction of the shift, known as fully productive time.
Simulation can be utilized as part of the overall process of improving OEE, determining a wide range of possible action items to improve availability, performance, and quality aspects of the production line

Schedule Adherence Percent
Most of today’s manufacturing facilities face many scheduling conflicts when it comes to building their family of products. As it is most often desirable to build according to market demand, scheduling products according to the placement of customer orders is common practice.
Flexible automotive manufacturing facilities allow for building families of vehicle models on the same assembly lines. The manufacturing metric Schedule Adherence Percent measures how well the original build schedule is maintained.
When building complex product variants there are several common ways for production to become out-of-sequence:
- Rework loops
- Parallel Lines
- Quality Tests
- Decouplers with short-cuts (buffers, mezzanines, and storage banks)

The benefits of maintaining the original schedule is not always about meeting customer demand in a timely fashion, but also focus on how subcomponents arrive lineside to assure a timely rendezvous for assembly. For example, labor searching for a specific subcomponent type can add critical seconds to the overall cycle time of a station.
How is Schedule Adherence Percent calculated?
Schedule Adherence Percent = (Actual Production / Scheduled Production) * 100
Simulation reduces the risk when implementing manufacturing facilities that strive for multiple product variance. It allows us to accurately model and test the various considerations, complexities and variance involved in mixed model assembly including:
- Takt / cycle times
- Downtime, changeovers and tool setups
- Product mix and scheduling schemes
- Introducing flexible tools
- Routing flexibility

Time in System / Dock to Dock
Total Time in System or commonly referred as Dock to Dock (starting from raw material to final shipping docks) is a performance metric that captures the time to complete a single product from start to finish.
Time in System, or Dock to Dock, can be measured at various points within the system and is usually measured according to a specified control part. For example, the control part may be identified at an early rendezvous station where a couple of subcomponents are assembled; signalling the start of the creation of the overall product.
This metric is especially useful when running mixed products down flexible assembly lines. It can aid with determining best scheduling scheme such as batch build sizes.
Simulation can be utilized to highlight and investigate the sources of longer build times such as bottlenecks, rework items, shift patterns, product variants, and lineside inventory.

Resource Utilization
Production operators such as line-side operators, shared task operators, forklift drivers and maintenance workers form a key aspect of the overall production process.
Simulation is effective for determining the best strategy for resource placement, as well as optimizing the balance of resource tasks.
Often manufacturers will have a balanced targeted utilization range for operators within the process, normally between 80 and 87% utilized, with equipment having higher target utilization rates.
Simulation is also valuable for providing great insight into complex shared tasks, including travel and walk times, as well as distinguishing between “automated” and “manual tasks” within a cycle time.
For example, we can view whether a station was waiting for a part, or waiting for the operator. This allows manufacturing engineers to design robust work stations that won’t pace the line, or become a bottleneck due to overloaded operator utilization.
Find out how these Automotive organizations used Simul8 to seriously improve processes, eliminate bottlenecks and reduce costs
Fiat Chrysler improved manufacturing throughput by 39 units and increased revenue by $1,000,000 per day at its Brampton plant.
Developing smarter maintenance rules, GM increased manufacturing throughput by 5% and met an increase in demand.
Learn more about Simul8
Explore the wealth of features that make Simul8 the #1 choice for simulation.
Learn more